ABSTRACT
When conducting surveys for primary elections, we noticed a persistent problem where the current frontrunner or best-known candidate would underperform, and by such an amount that it was regularly outside the margin of error for that candidate only. Using over 107,000 collected respondents from 158 primary surveys we’ve conducted in the 2024 cycle in the last 30 days before the election, we determined that the ability to name more candidates had a direct impact on how likely they were to ultimately vote or stay home for the election. Additionally, we found significant effects on increased turnout when they had stronger opinions of the known candidates or heard of candidates and made a decision on who to vote for on the ballot. This research has identified a problem with election polling where we can account for a direction of likely error or adjusting the electorate for likely votes that goes beyond self-selecting into saying that you will be voting and can predict if the leading candidate’s support is real or only surface level. The observed effect was especially strong among lower propensity voters who have voted in less than half of their eligible primaries. We also found that live caller surveys were much more likely than text-to-web to collect respondents that did not have an opinion on any or multiple candidates and then were less likely to vote. This suggests that there is a chronic problem with the live-caller only polling where you cannot compare samples and could be one of the leading reasons why recent misses have moved it away from being called the industry gold standard.
BACKGROUND
Pre-election polling for a private company means that you are trying to make a prediction as accurately as possible in the upcoming race. All these polls are trying to improve accuracy on two axes: who will vote and who will they vote for. There is good literature on how a survey questionnaire can more accurately measure vote choice, through implicit bias (Ksiazkiewicz 2017), question wording and order (Lampert 1978) and getting a representative sample of a demographic group (Pérez-Salamero González 2016). The other side of this, where we try to contact respondents and let them tell us if they will vote, still has a gap in the literature.
Most of the focus on figuring out if a respondent will vote focuses on demographic characteristics inherent to the respondent. This mostly centers around status where there are findings that those with more formal schooling (Sondheimer 2010) or more wealth (Nadeau 2019) are more likely to vote, especially in low turnout primaries. It is also well documented that those who have voted before (Cebula 2008) in this type of election will vote again in an upcoming similar election. When you are working off the voter file on the private side, we have this vote history built in but not everyone in the same bucket all votes the same way all the time and you could introduce error by assuming only and all high propensity voters will show up. Additionally, there is evidence that random sampling already overcollects the portion of the population that only shows up a portion of the time but moderately follows the news and feels a social desirability bias to say that they are likelier to vote than their real intentions (Sciarni 2016). Generally, the issue is that there is a general overreporting but a wider survey across countries turned up no real reason why some places were higher than others but that the direction was almost always that it was a lower turnout than those that were surveyed said it would be (Selb 2013). The standard way to try account for who will vote across surveys is to introduce an initial question at the top of the questionnaire. At Cygnal, our vote intention question is the following shown in Figure 1 taken off a recent public survey.
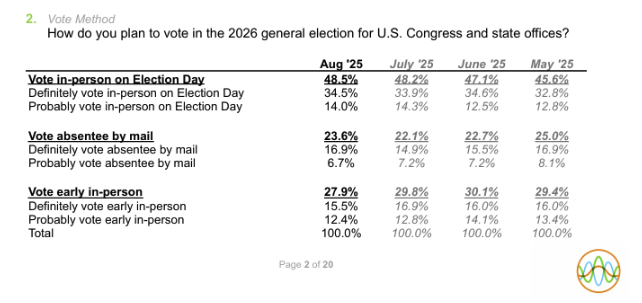
Fig. 1 A report of the answer options in a recent public Cygnal poll that are allowed past the screener and the results of the last few months
Literature says that there is evidence that a more competitive primary election can drive up turnout (McGee 2014). And that for any election, reading and watching the news generally led to higher turnout (Smets & van Ham 2012). Campaign effects were also observed to have a larger impact in rural and less educated areas that started with lower turnout (Ali Ch 2024). We aim to explore why. This paper keys in on a group of people that say that they will vote and end up self-selecting in as voters but are not actually paying enough attention to the election and will end up not voting. We posit that when campaigns inform the public about an election, and they develop opinions on candidates strong enough, it motivates them to vote. This is in line with the findings from a natural experiment in Denmark that being informed led to a significant rise in turnout, though it was not a US primary election and focused on direct impact of an election and not a campaign (Lassen 2004). By looking at the image questions for the candidates, we also show that you can help with turnout projection using another commonplace question regularly included in polling that does not need to add more in survey length and isn’t fully reliant on a direct question asking vote intention.
Results
The two major concerns we had with splitting the data for analysis concerned different base levels to turn out and the amount of resources a campaign would be spending on awareness. We filtered down responses to only races that asked all the major candidates’ images in a primary race and split out by whether it was a state legislative race or a statewide or congressional race which usually have more resources to boost candidate image. This left us with a n=107,307 overall respondents across our recent polls. Figure 2 below is a table that shows the total overall respondents and the breakout by our voter turnout categories we use for analysis based on the share of eligible even-year primaries that a voter has participated in. The second column, denoted with, “%”, shows the share of respondents that ended up voting. Overall, 66.0% of respondents that had gone through the filter voted and there was a large difference by past voter behavior. For all tables, a single asterisk (*) denotes a case where the number is statistically significant with a p<.05 from the previous number in the row above it while a double asterisk (**) like the ones below are statistically significant with a p<.01.
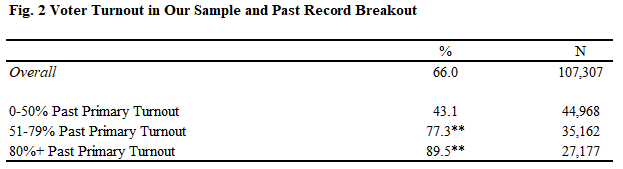
It’s not a concern for this metric but for the measures broken out by awareness in the subsequent charts, we have split up the data into the smaller races and the larger races where the congressional and statewide elections tend to have more respondents name more of the candidate options and have an opinion because they see more advertising.
Awareness of Candidates
The term, “awareness,” for a candidate in our polling centers on the question of the image of the candidate being asked. We give a 5 term Likert scale on favorability and make the final option be the phrase, “Never heard of.” Awareness is all the other responses added up that aren’t the Never Heard Of option, including if someone said that they have no opinion. Figure 3 shows our typical wording on this question for Donald Trump and in this case the awareness is at 99.9% but of course is varying degrees less for other candidates for office. For future reference, when the phrase, “Heard Of,” is used, it means that someone selected one of the options that would be categorized as aware.
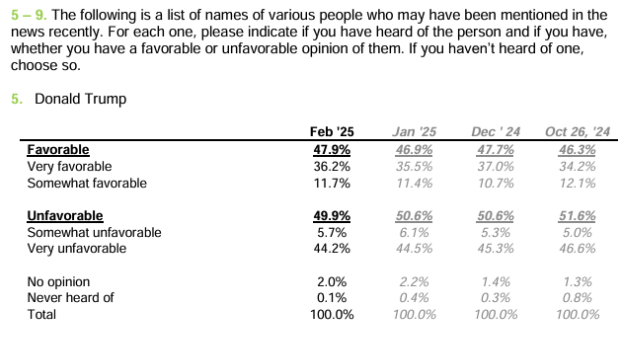
Fig. 3 A report of the answer options in a recent public Cygnal poll that has been asking the favorability of President Donald Trump
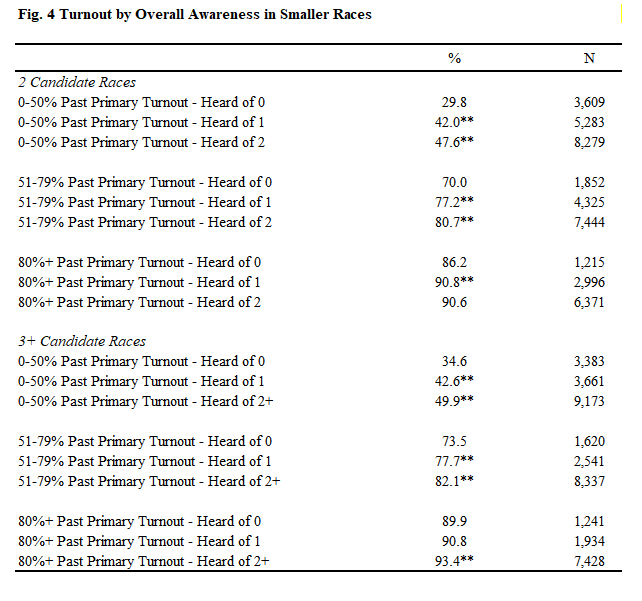
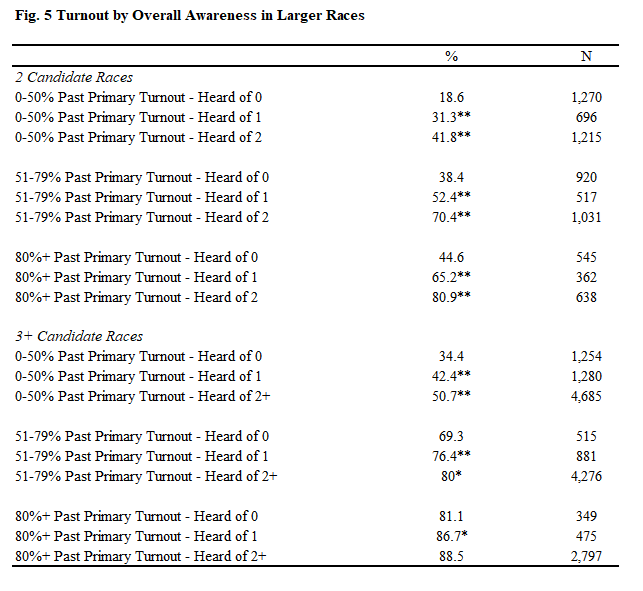
In head-to-head races and multi-candidate races, a respondent marking that they are aware of more candidates makes them significantly more likely to actually turn out to vote, as seen in Figures 4 and 5, which look at smaller and larger profile races, respectively. And similar to Ali Ch (2024)’s findings, we find a larger jump in turnout among voters with less history of showing up, followed by a weaker significant effect among mid propensity voters, and finally a mixed impact on turnout among the voters who show up for nearly all or every election. These results reveal that even for those respondents who already said they intended to vote, there is another layer of knowledge or investment in the race driving the decision to ultimately come out in support.
Intensity of Opinion
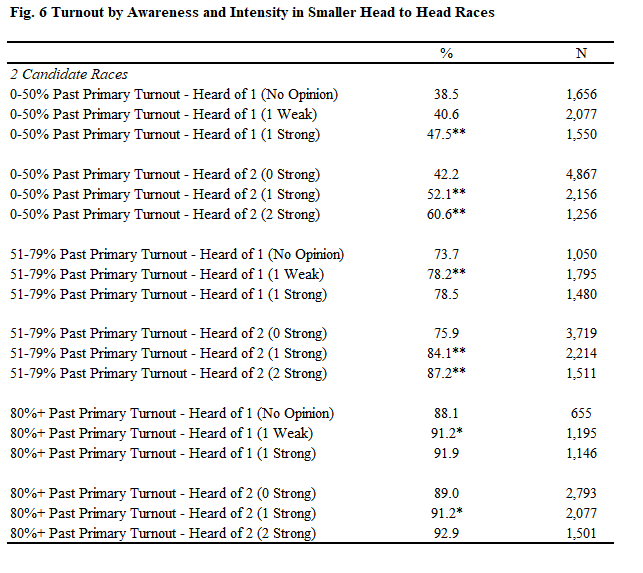
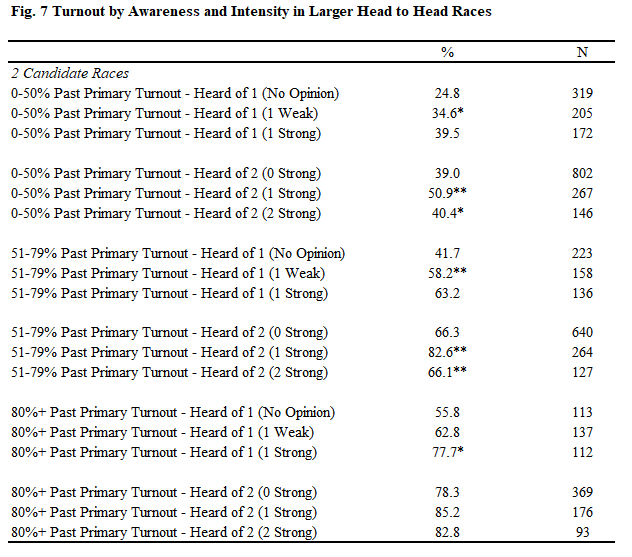
Figure 3 also showed that our answer options allow the respondent to check not just a favorable or unfavorable opinion, but also the intensity. We refer to the answer options of Somewhat Favorable or Somewhat Unfavorable as a, “Weak,” opinion, while the Very Favorable or Very Unfavorable options are called, “Strong,” opinions. For Figure 6 and 7, we looked at the head to head races for small and large campaigns respectively, and took the previous chart but also broke it up into subcategories based on if the respondent had heard of one or more candidates and how intense they rated those candidates. Here we again see that this made a significant difference in most cases, with turnout increasing if you held any opinion or a stronger opinion for more candidates. And once again, the effects are strongest for those who have voted in less than 80% of previous eligible primaries.
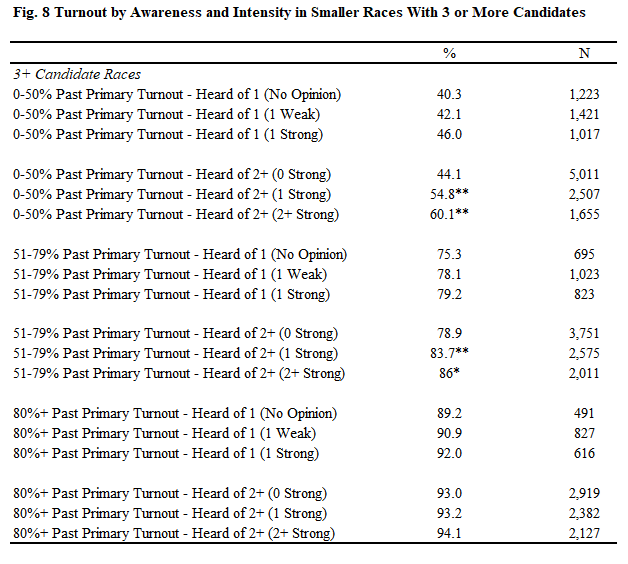
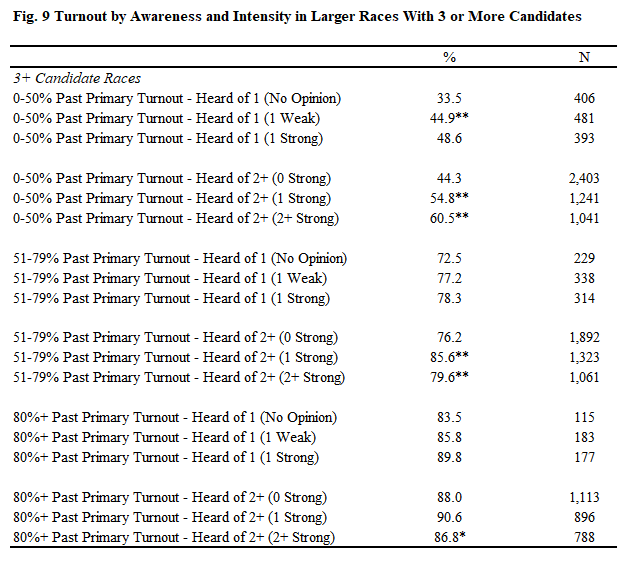
Figures 8 and 9 looked at the campaigns with three or more candidates and only found consistent significant effects on turnout among those low and mid-propensity voters when the number of strong opinions increased, but no difference if the respondent was only aware of one of the candidates. This explains more of that false frontrunner effect, where hearing about one candidate alone is enough to give them a tentative base of support that will not show up while hearing about a second candidate and still holding an opinion more reliably captured an actual voter.
Ballot Choice
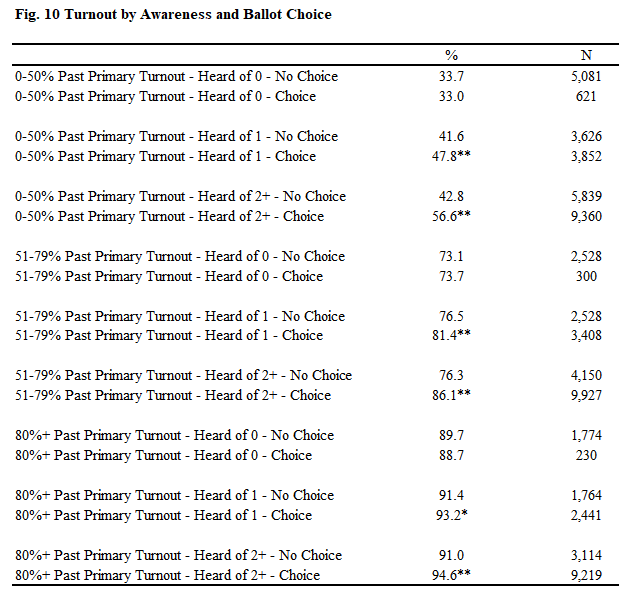
Respondents can have opinions on candidates, but the other important measure is the ballot question itself. This is where we ask the respondent to choose who they are currently planning to vote for out of all the options on the ballot. If they chose a name, we said that they made a choice but the respondent can always choose the Undecided or Unsure options where they do not make a choice. Figure 10 breaks out the past voter turnout and how many candidates the respondent had heard of but then breaks down the turnout rate depending on whether they made a choice on the ballot or not. We see a significant effect on turnout from choosing an option if the respondent had heard of at least one candidate with no difference if they made a choice but had not heard of any candidates, showing a two way effect on turnout for both factors. Once again, the effects got smaller as past voter history increased.
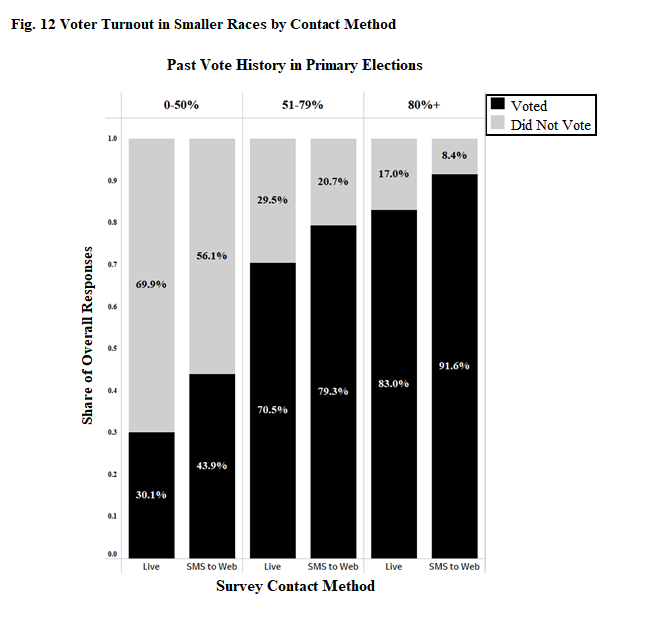
Contact Method
We also noticed that there was a large effect on races based on the contact method. Our firm specializes in multi-modal collection of data and the two largest are Live Caller and Text-to-Web. Live caller involves handing the script to a call center where people dial from a list of voters to solicit a complete survey. Text to web, or SMS to web, involves sending a text message out to targeted eligible voters with a link to our survey on a website. The respondent clicks on the link and they are taken to our survey which they complete on the site. Especially when it came to weaker frontrunners, we found that their shares were higher on Live Caller than SMS to web and investigated. Figure 11 below shows that when sorting out by past vote history, live caller responses were much less likely to be able to recall even one candidate and were much less significantly able to recall at least two candidates.
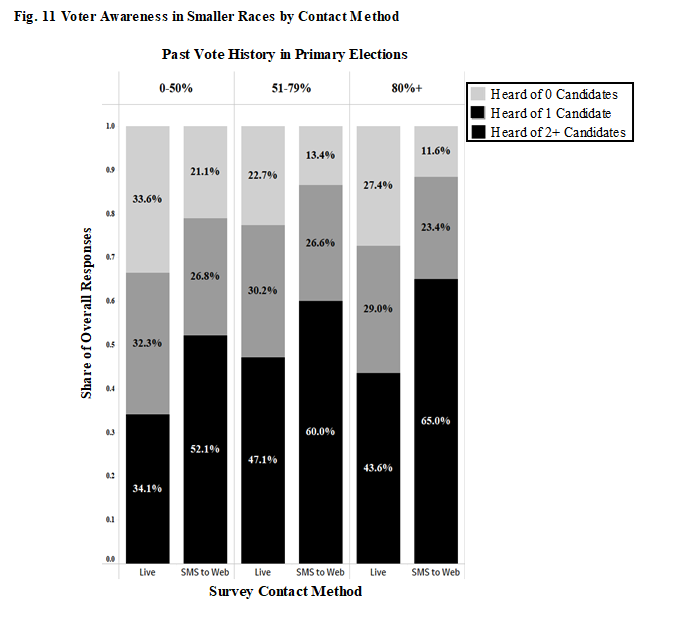
Figure 12 backs up the findings from the previous sections, and live caller respondents were also significantly less likely to vote with the 0-50% vote history gap being the largest.
Conclusions
The results of this study shows that we can not rely fully on one screener question to identify the likelihood that any respondent will vote in primary elections. Instead, we can gauge the interest and emotional investment in the race using commonplace questions in nearly every poll with candidate images and the ballot question. Because hearing about candidates and having a stronger opinion causes an increase in turnout, we can also imply that there are campaign effects to turnout with more candidate spending or coverage leading to a bump in voters. Furthermore, finding that live calling leads to less informed voters means that adjusting or watching this metric could lead to more accurate polling and more harmony across polling that consists of several methodologies.
References
Ali Ch, Awais, Dr Nadia Zaheer Ali, Wali Muhammad, Dr Wajiha Yasir, Mohammad Jahangir Khan, and Mehreen Faiza. 2024. Review of THE IMPACT of POLITICAL AWARENESS on VOTER TURNOUT in URBAN and RURAL AREAS of PAKISTAN. Contemporary Journal of Social Science Review 2 (4): 1283–96. https://contemporaryjournal.com/index.php/14/article/view/200.
Cebula, Richard J., Garey C. Durden, and Patricia E. Gaynor. 2008. “The Impact of the Repeat‐Voting‐Habit Persistence Phenomenon on the Probability of Voting in Presidential Elections.” Southern Economic Journal 75 (2): 429–40. https://doi.org/10.1002/j.2325-8012.2008.tb00912.x.
Kam, Cindy D., and Elizabeth J. Zechmeister. 2013. “Name Recognition and Candidate Support.” American Journal of Political Science 57 (4): 971–86. https://doi.org/10.1111/ajps.12034.
Ksiazkiewicz, Aleksander, Joseph Vitriol, and Christina Farhart. 2017. “Implicit Candidate-Trait Associations in Political Campaigns.” Political Psychology 39 (1): 177–95. https://doi.org/10.1111/pops.12398.
Lampert, Shlomo I. 1978. “A New Approach to Pre-Election Polling.” Public Opinion Quarterly 42 (2): 259. https://doi.org/10.1086/268447.
Lassen, David Dreyer. 2005. “The Effect of Information on Voter Turnout: Evidence from a Natural Experiment.” American Journal of Political Science 49 (1): 103–18. https://doi.org/10.1111/j.0092-5853.2005.00113.x.
McGhee, Eric. 2014. Voter Turnout in Primary Elections. San Francisco: Public Policy Institute of California. https://www.ppic.org/wp-content/uploads/content/pubs/report/R_514EMR.pdf
Nadeau, Richard, Michael S. Lewis-Beck, and Martial Foucault. 2019. “Wealth and Voter Turnout: Investigating Twenty-Eight Democracies.” Polity 51 (2): 261–87. https://doi.org/10.1086/701961.
Perez Salamero Gonzzlez, Juan Manuel, Marta Regglez-Castillo, and Carlos Vidal-Melii. 2015. “A Procedure for Selecting Representative Subsamples of a Population from a Simple Random Sample.” SSRN Electronic Journal. https://doi.org/10.2139/ssrn.2655972.