
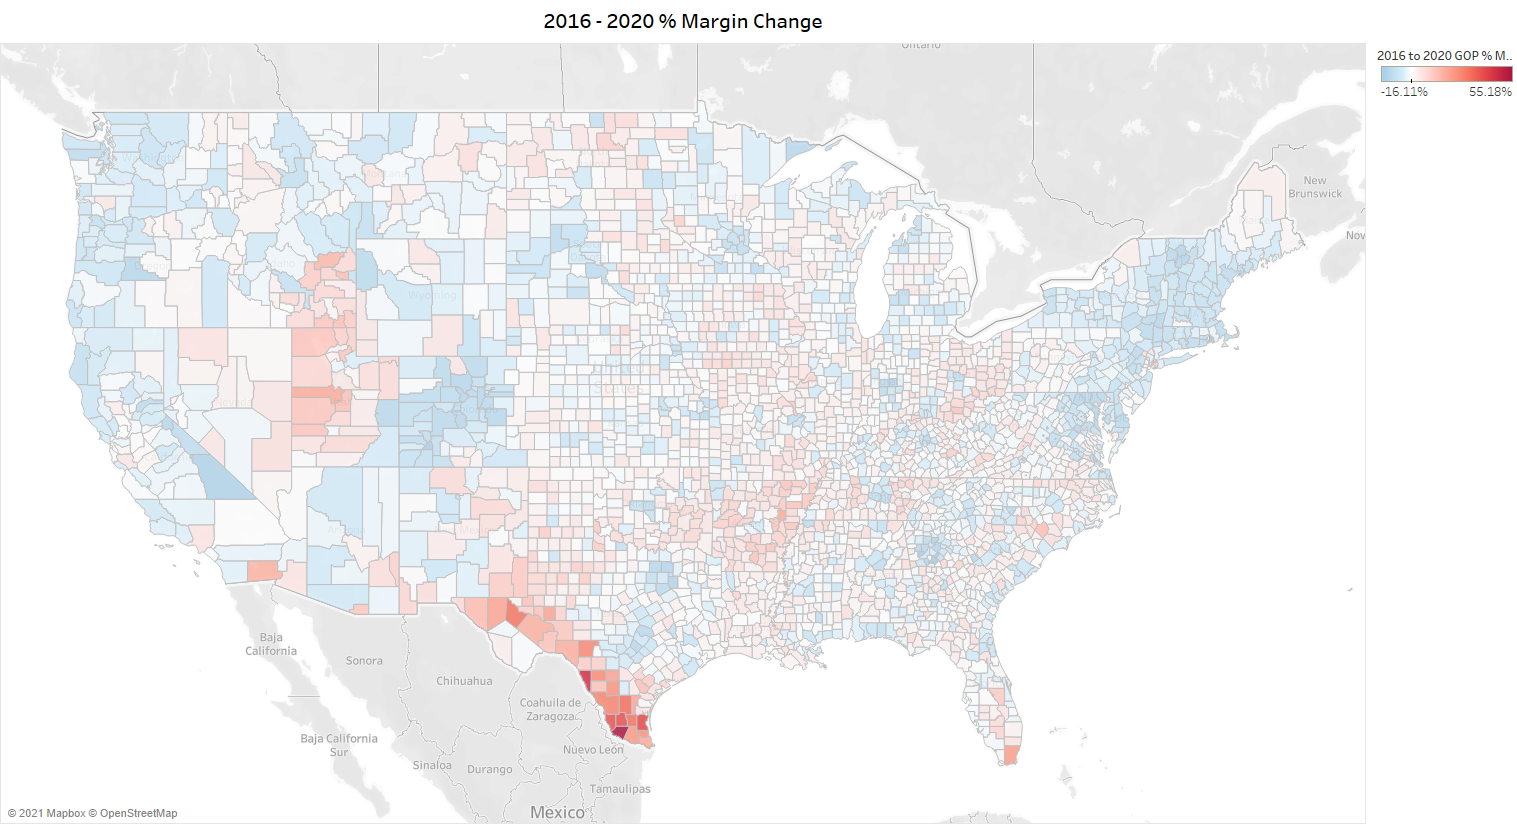
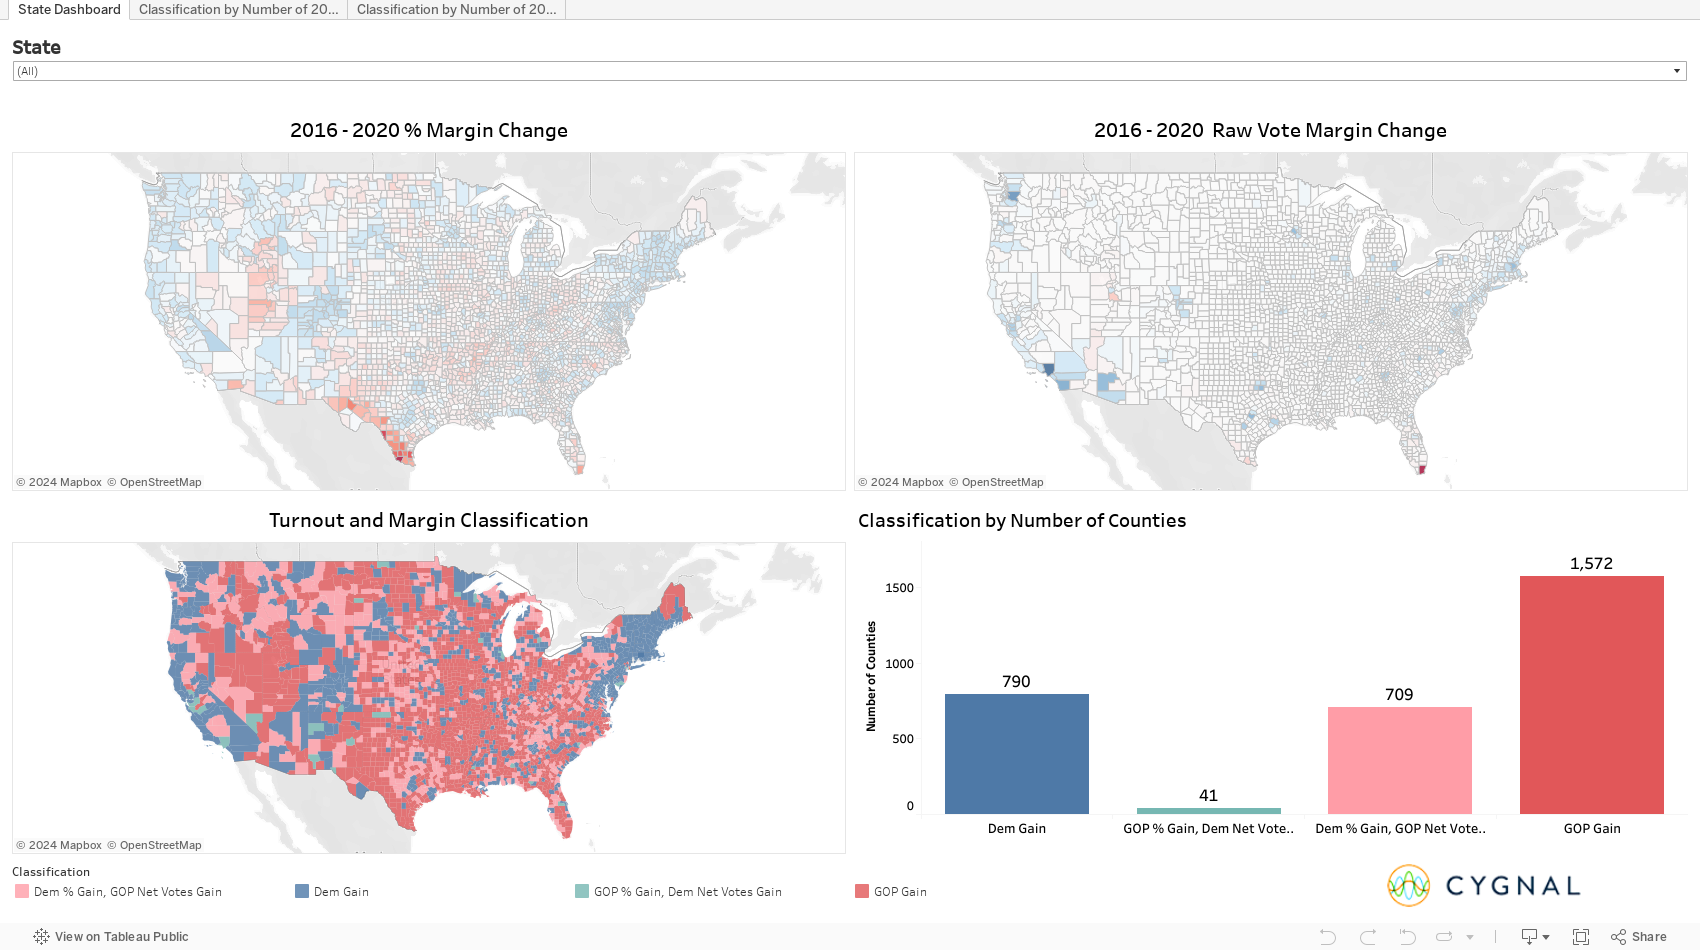
Below is a map showing the change in the margin between 2016 and 2020. I’m sure you’ve seen it many times before but if not, this looks like a lot of blue. One of the reasons that it appears blue is that Biden made gains in the margins of rural counties, especially in places like the Midwest and Appalachia, where other Democrats have struggled. Yet, these supposed gains may have just been a mirage as turnout surged everywhere and Trump got more votes from smaller counties than ever before. This analysis explores a new way to look at the 2020 results and identify which of the Democratic gains were real – and which were imaginary.
Margin doesn’t show the whole story, and it really comes down to the vote totals. It’s why we included the following map showing the change in the raw vote margin change since 2016. Blue counties like Los Angeles or the area around Denver show where Democrats added the most net votes while red counties, such as Miami, show where Trump gained the most net votes.
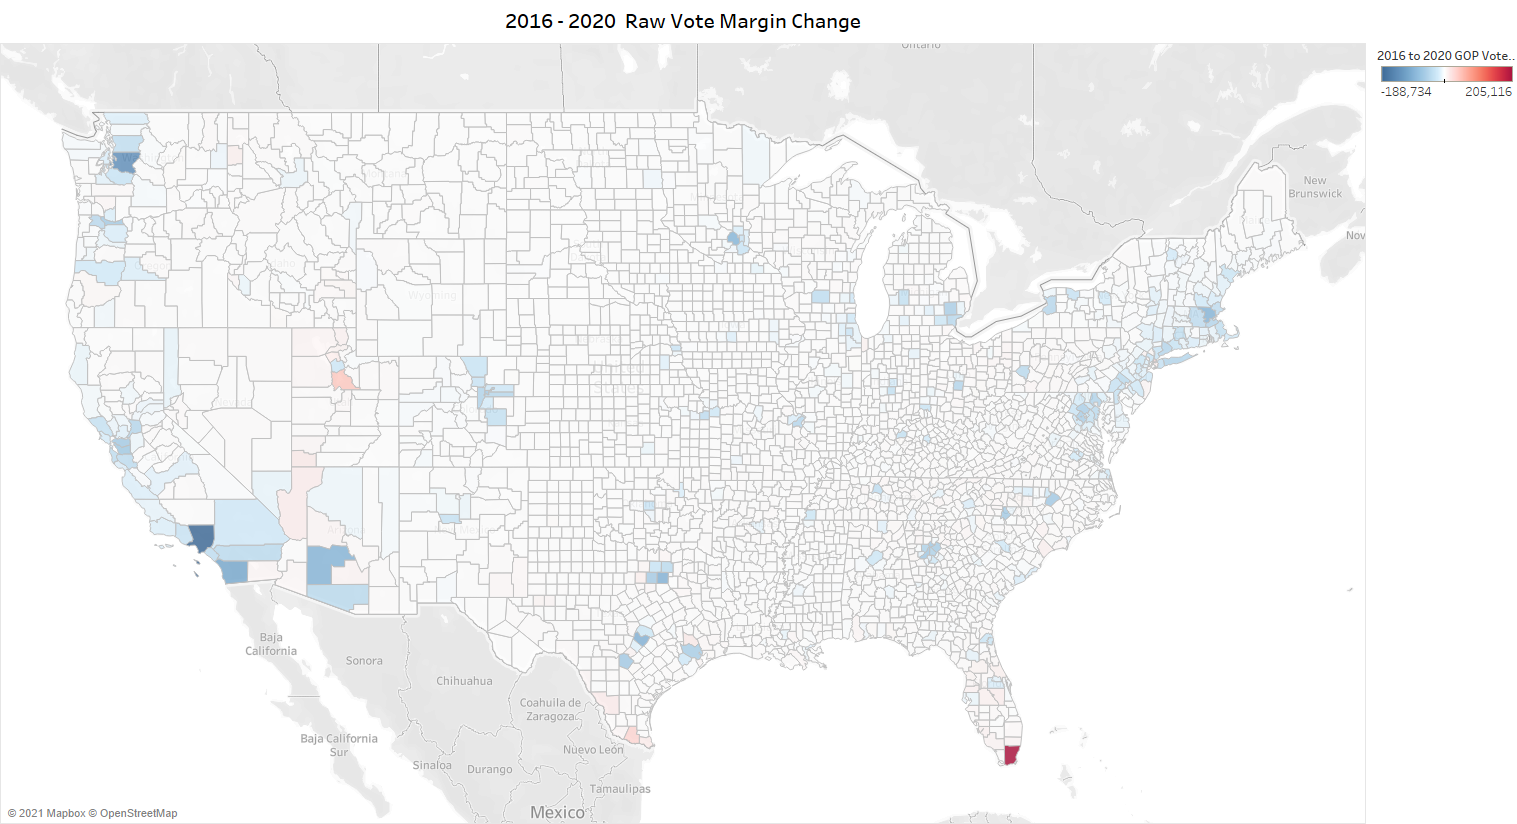
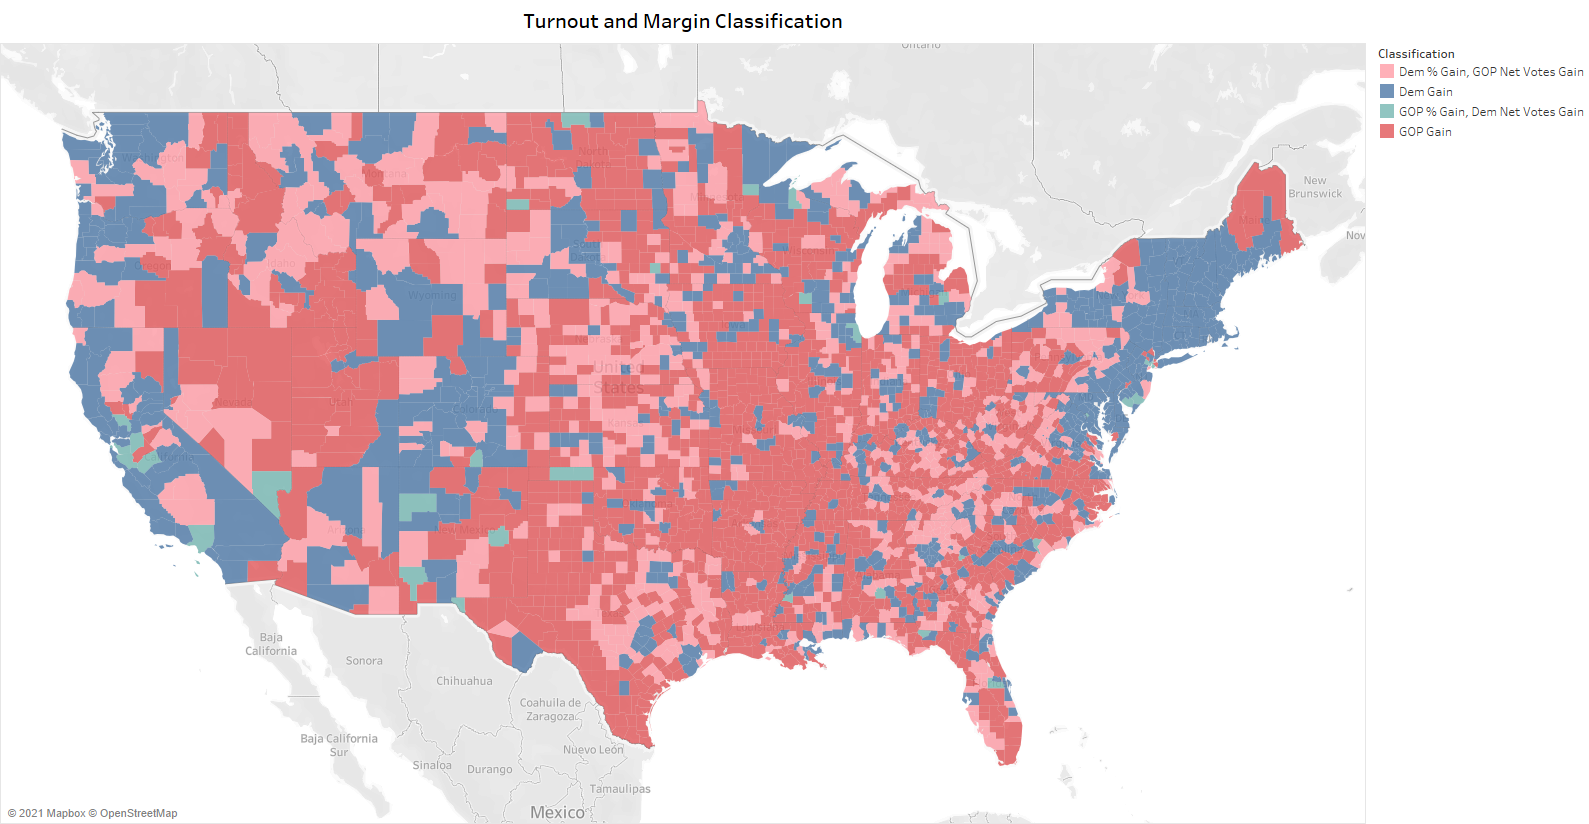
Democrats made big gains in the cities and all along the Beltway in the diagonal line in the Northeast, while Republican net vote gains are clearer in Miami, Southern Texas, and Utah county. Now let’s combine the two in the map below. Here, counties are divided up into one of four categories:
Dark Red: Republicans gained in the vote share margin and net votes. This happened mostly in rural counties but also in places like Southern Texas and Southern Florida.
Light Red: Democrats gained in the percent margin, but Trump netted more votes, you can see these false gains in the Plains and Appalachia.
Light Blue: Republicans gained in the vote share margin, but Democrats netted votes. Mostly in urban centers like Los Angeles and Las Vegas.
Dark Blue: Democrats made gains in the vote margin and in raw votes. Mostly along the coasts but also in key cities in places like Texas or even crucial swing state areas like Detroit and Milwaukee.
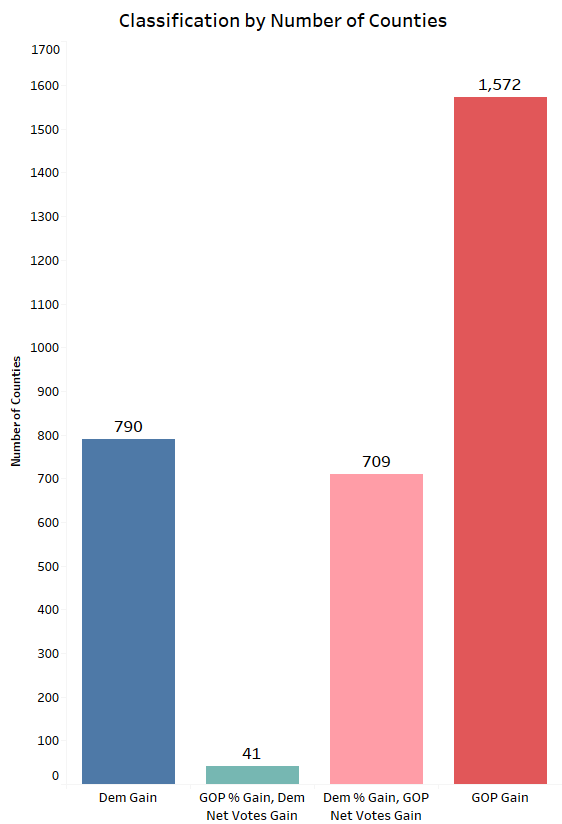
The chart below shows the total number of counties that fit into these classifications, and while Democrats made a percent margin gain in nearly half of the counties overall, they only really netted votes from about 25%. The rest saw such high turnout that, even though they nudged to the left a little bit, Trump was able to get more net votes from half the counties that moved towards Democrats this time around than he did in 2016.
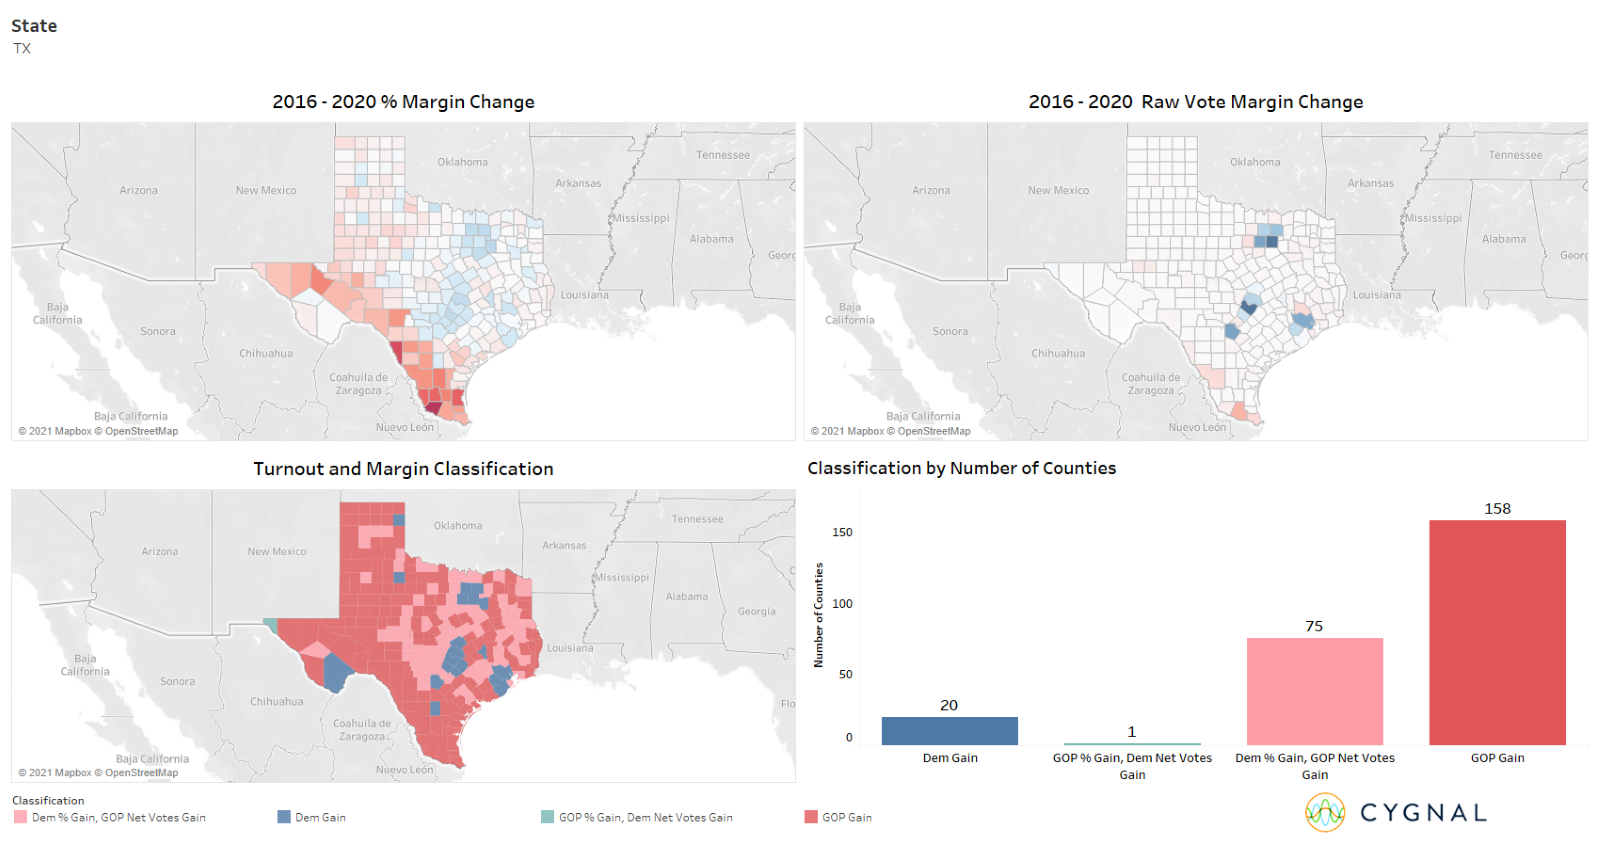
For one to explore these counties up close, Cygnal has created an interactive dashboard where you can select a state and see the margin change, raw vote change, and the classification of the counties on a map and in the totals. Hover over a county to see the name and all the relevant shift numbers.
One thing that stuck out was how many Democratic counties in smaller, more rural counties seemed to shift to the left but gave Republicans more votes during this cycle. Below is a chart that breaks up the smaller counties into buckets based on how many votes there were in total in 2020, and it shows which party made gains by percentage. The blue means that the margin shifted to the Democrats, and red means that it moved towards Republicans.
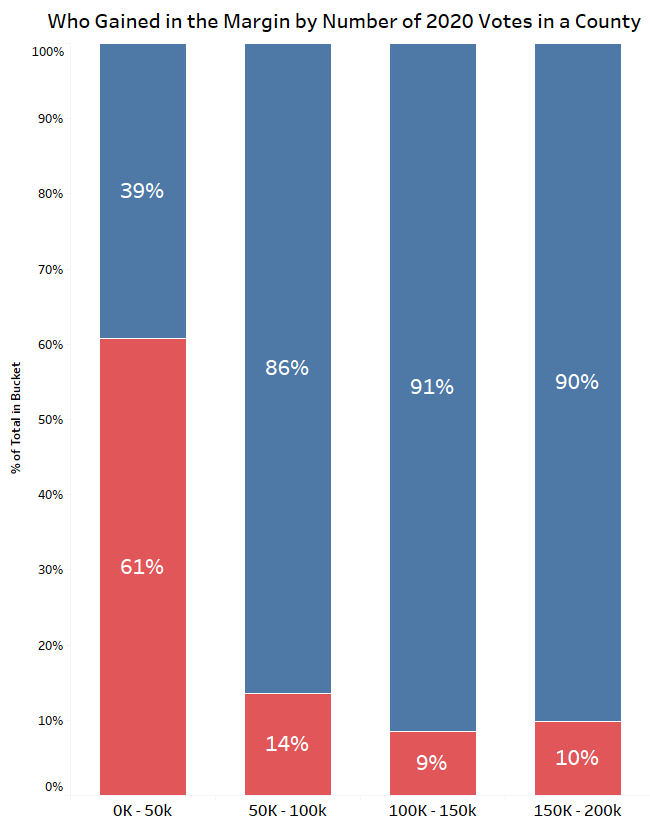
Looking only at margin, we can see that Republicans made gains in just over 6 of 10 counties, where up to 50,000 people voted. However, Democrats made gains in about 90% of smaller (but not the smallest) counties, a substantial number. From this, it could be inferred that Democrats made real gains in the rural areas that they have suffered in recently. When you look at the net votes, however, the density polarization comes into play, as in the graph below that now shows our new classification system.
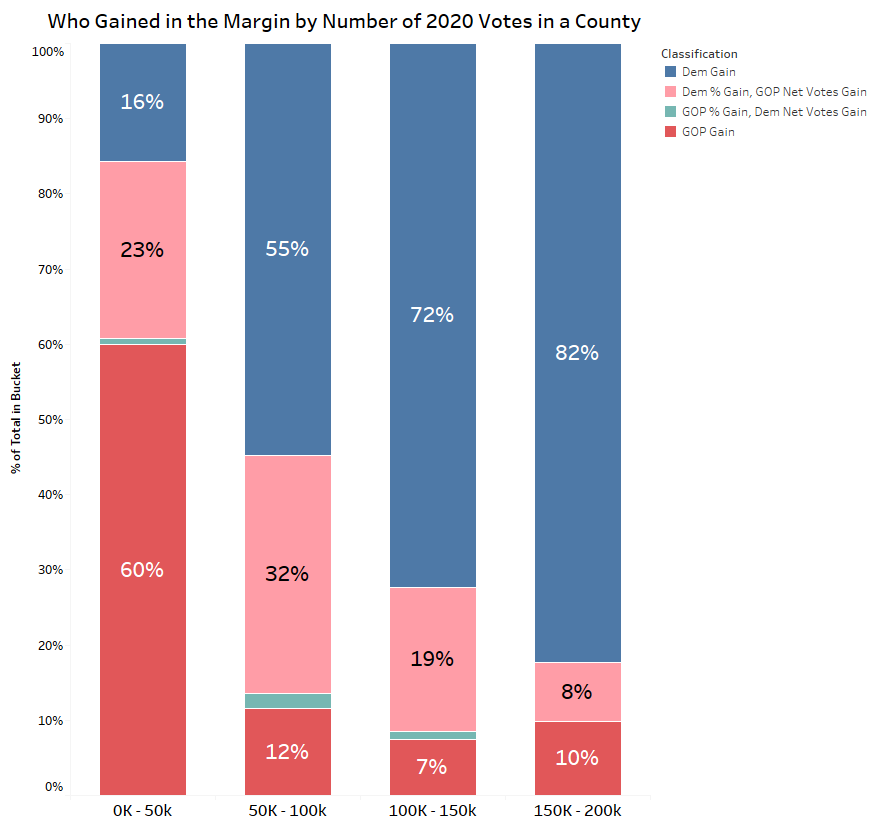
Several gains in the counties that had between 50k and 150k votes may have shifted to Democrats in the margin but actually netted Trump more votes. Democrats did better as the number of people in a county increased. This looks a lot different than the flat 90% rate as the previous chart. Over half of the smallest counties, where Democrats gained in the percentage, still saw Republican’s net votes.
Overall, high turnout has scrambled how we interpret these shifts to the 2020 election beyond looking at margin. This will matter a lot going forward. If Democrats really did not increase in rural areas, it means that polarization may have increased even more when looking at the raw total counts. Going into 2022 and beyond, any partisan difference where one party’s voters turn out less than another can lead to a larger gap than before. Identifying and turning out infrequent voters has never been more important.