It wasn’t quite a tsunami, but it was definitely a wave – especially in the US House. Statewide offices in several states we polled a week before the election, however, were a different story. (TL;DR We told you so! 😉)
Links to full poll results: Florida, Georgia, Indiana, Missouri, Ohio, Tennessee
Turnout in Florida, Georgia, and Tennessee was significantly higher than expected for midterm elections, at least in terms of raw numbers. In Florida, over 8 million votes were cast, representing 61% of registered voters. That turnout is only 11 percentage points off of 2016 (72%), and well over the 50% turnout in 2014 (the previous midterm election).
Georgia is even more remarkable – almost 4 million voters participating in Tuesday’s election. The turnout drop from 2016 (64%) is similar to Florida’s, but the increase from 2014 to 2018 is over 14% more turnout. Tennessee’s decrease from 2016 is the lowest at 8% (71% to 63%), but it had by far the largest increase over the last midterm – 23% (40% to 63%).
On the other end of the spectrum is Ohio. Prior to the election, our poll showed Ohioans’ interest in the election with the lowest intensity of the states we surveyed. Only 65% of voters expressed either a nine or ten on a Likert Scale rating (scale of 1-10) for their level of interest in the election. Unsurprisingly, Ohio had a 17% drop-off in turnout (71% – 54%) from 2018 to 2016, and by far the lowest 2018 midterm turnout at 54%.
Despite these challenges, we were able to accurately peg every single statewide race in our six publicly-released polls more than a week before the election. Of the 10 races we polled, we were inside the margin of error on 7 and called the correct winner in all but one, the Florida US Senate race (we had it D+1.8 and it went R+.4). That includes being within 0.6% of the spread in the Georgia governor’s race, and the exact spread of 0.6% in the Florida governor’s race.
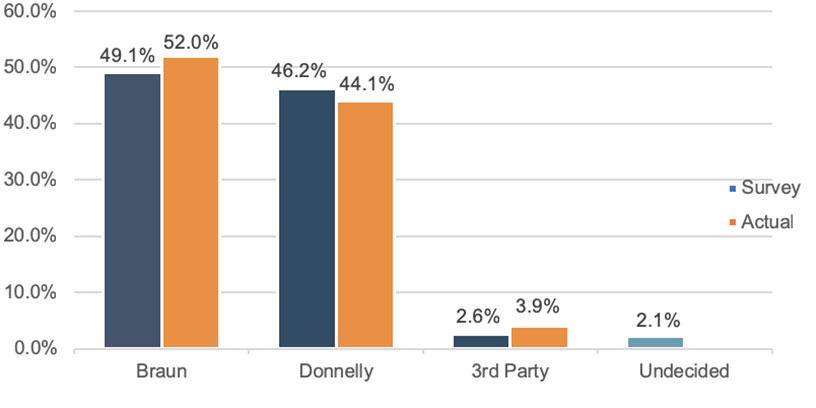
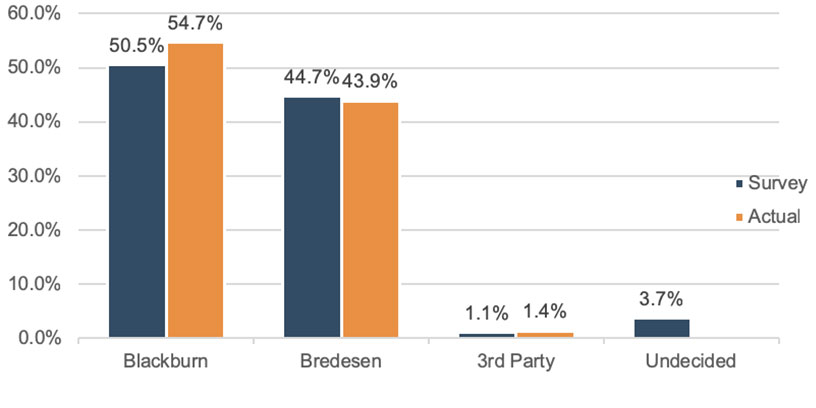
The only races where we were outside the margin of error – Marsha Blackburn’s (TN) and Mike Braun’s (IN) senate victories and Chris Carr’s Attorney General win in Georgia – we still had the correct winner and were less than 1% outside the margin of error in each of those “misses.”
| Poll Spread | Actual Spread | Difference | |
| Florida Governor | R+0.6 | R+0.7 | 0.1% |
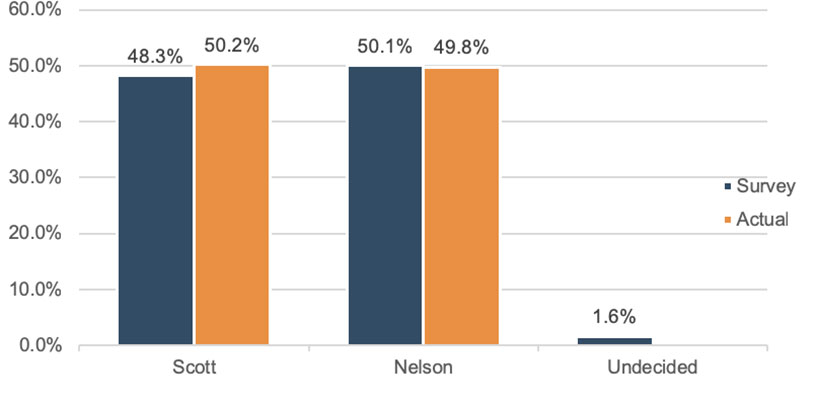
| Florida Senate | D+1.8 | R+0.4 | 2.2% |
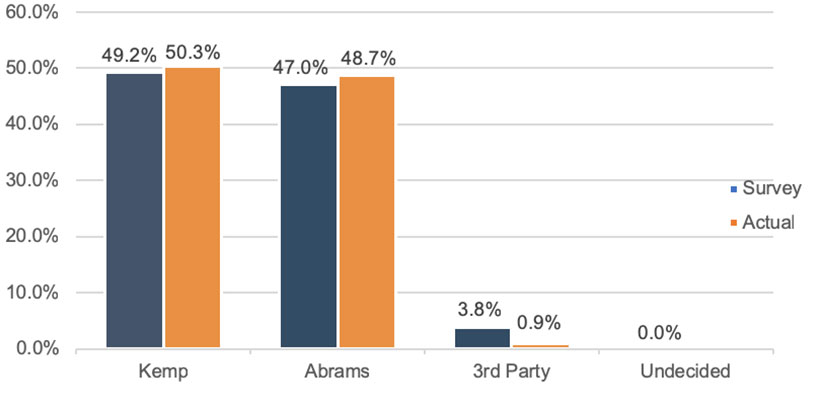
| Georgia Governor | R+2.2 | R+1.6 | -0.6% |
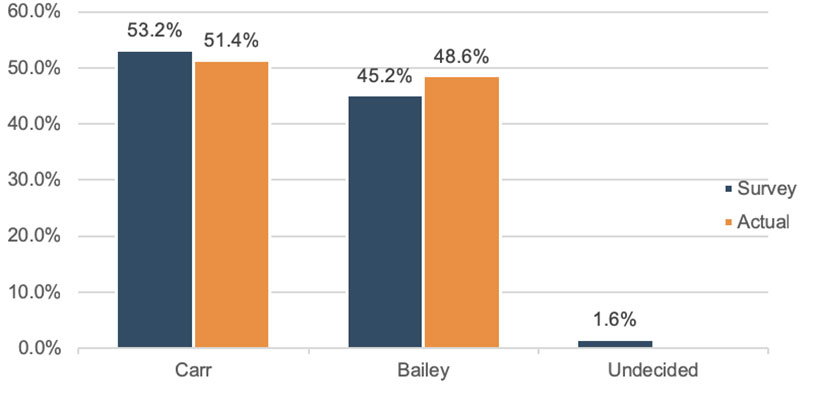
| Georgia Attorney General | R+8 | R+2.8 | -5.2% |
| Indiana Senate | R+3 | R+7.9 | 4.9% |
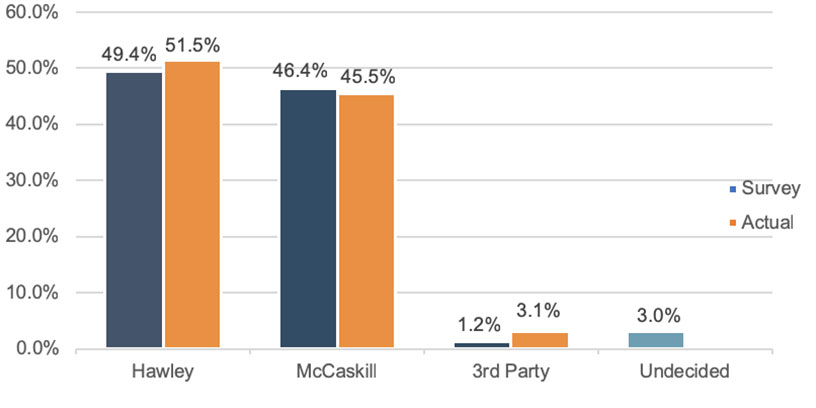
| Missouri Senate | R+3 | R+6 | 3.0% |
| Ohio Governor | R+0.2 | R+4.3 | 4.1% |
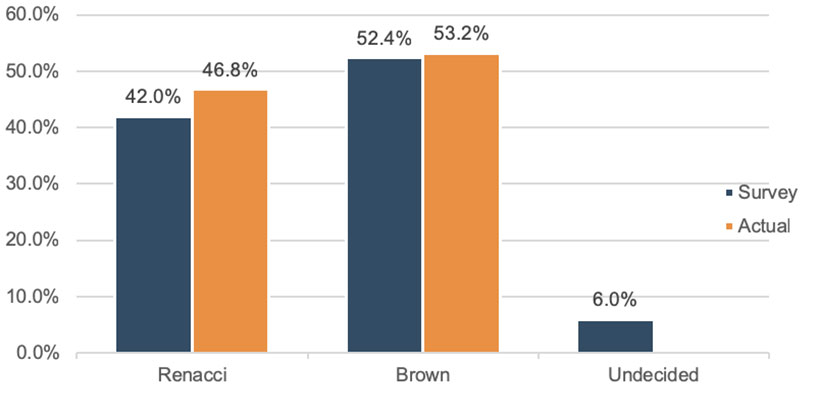
| Ohio Senate | D+10.4 | D+6.4 | 4.0% |
| Tennessee Governor | R+23 | R+20.9 | -2.1% |
| Tennessee Senate | R+5.8 | R+10.8 | 5.0% |
Survey Results vs. Actual Results from Top Races
FL Gubernatorial Ballot (4.40% MoE)
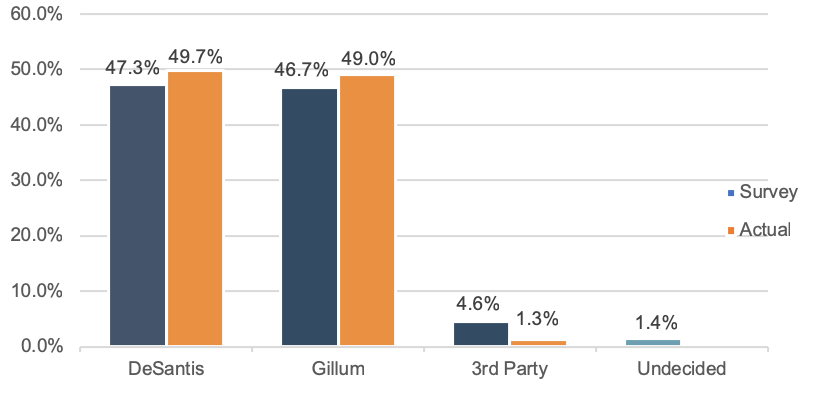
FL Senate Ballot (4.40% MoE)
GA Gubernatorial Ballot (4.36% MoE)
GA Attorney General Ballot (4.36% MoE)
OH Gubernatorial Ballot (4.37% MoE)
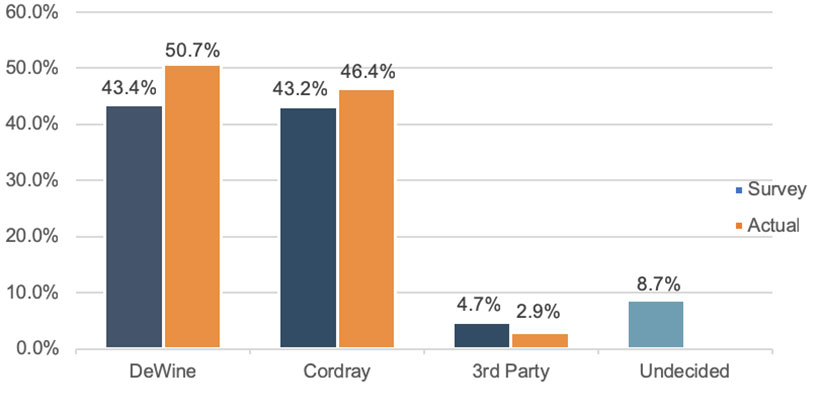
OH Senate Ballot (4.37% MoE)
IN Senate Ballot (4.36% MoE)
MO Senate Ballot (4.38% MoE)
TN Gubernatorial Ballot (4.40% MoE)
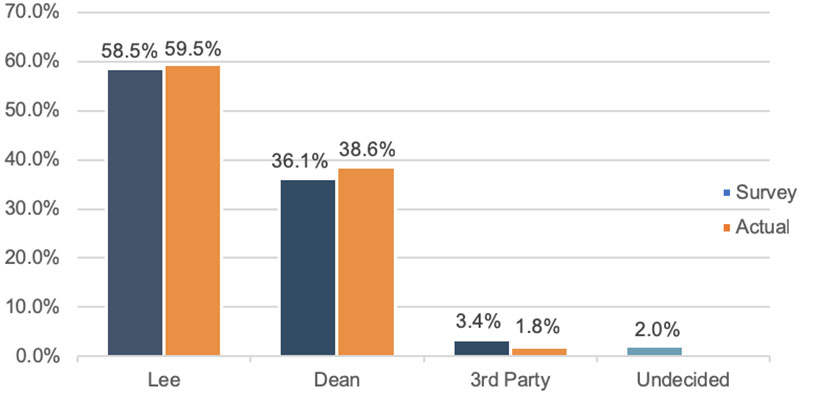
TN Senate Ballot (4.40% MoE)
Conclusion
Polling has an element of art, to be sure. But it’s still ultimately a science. In a challenging election cycle like 2018, sound science trumps (sorry!) speculative art. Sound methodologies coupled with spotting underlying trends in the data like voter enthusiasm, or lack thereof, are at the heart of what we do. Just as in the past when we’ve had results that we ourselves – and others – questioned, we trusted the science. And science won again.
DISCLAIMER: Cygnal cannot be held responsible for the ”finding” of new votes in Broward and Palm Beach Counties.